Chapter: 9 Publishing and Sharing Your Report
You have cleaned your data, built a robust star schema, defined clear indicators with DAX, and designed a user-friendly dashboard.
But right now, that value is trapped on your laptop.
A dashboard only becomes a monitoring system when it reaches the people who need to make decisions. This chapter covers the final mile: moving from Power BI Desktop (the kitchen) to the Power BI Service (the restaurant).
9.1 The Difference Between Desktop and Service
It is vital to understand the two environments:
-
Power BI Desktop (The Authoring Tool):
- Where you connect to data, write DAX, and design visuals.
- Analogy: This is the kitchen. Only the chefs (Data Analysts) should be here.
-
Power BI Service (The Consumption Portal):
- The website (
https://app.powerbi.com) where users view and interact with reports. - Analogy: This is the dining room. This is where the District Health Officers and Program Managers sit.
- The website (
Rule of Thumb: Never email a
.pbixfile to a stakeholder. Always publish it to the Service.
9.2 Before You Publish: The Reality of Licensing and Access
Before you click “Publish,” you need to know three administrative realities. Power BI Service is not open access like a Google Doc.
9.2.1 1. You Need a Work or School Account
You generally cannot sign up for Power BI Service with a generic email provider like @gmail.com, @yahoo.com, or @outlook.com.
Requirement: You need an organizational domain (e.g.,
name@ministryofhealth.govorname@ngopartner.org).Workaround: If you are learning on your own and do not have a work email, you can sign up for the Microsoft 365 Developer Program, which provides a free, renewable sandbox domain.
9.2.2 2. “Free” vs. “Pro”
Power BI Free: You can publish to your own private workspace (“My Workspace”). You can view your own reports on the web. However, you cannot share reports with others.
Power BI Pro: Required to share reports and view reports shared by others. This creates a licensing cost for the organization (roughly $10/user/month).
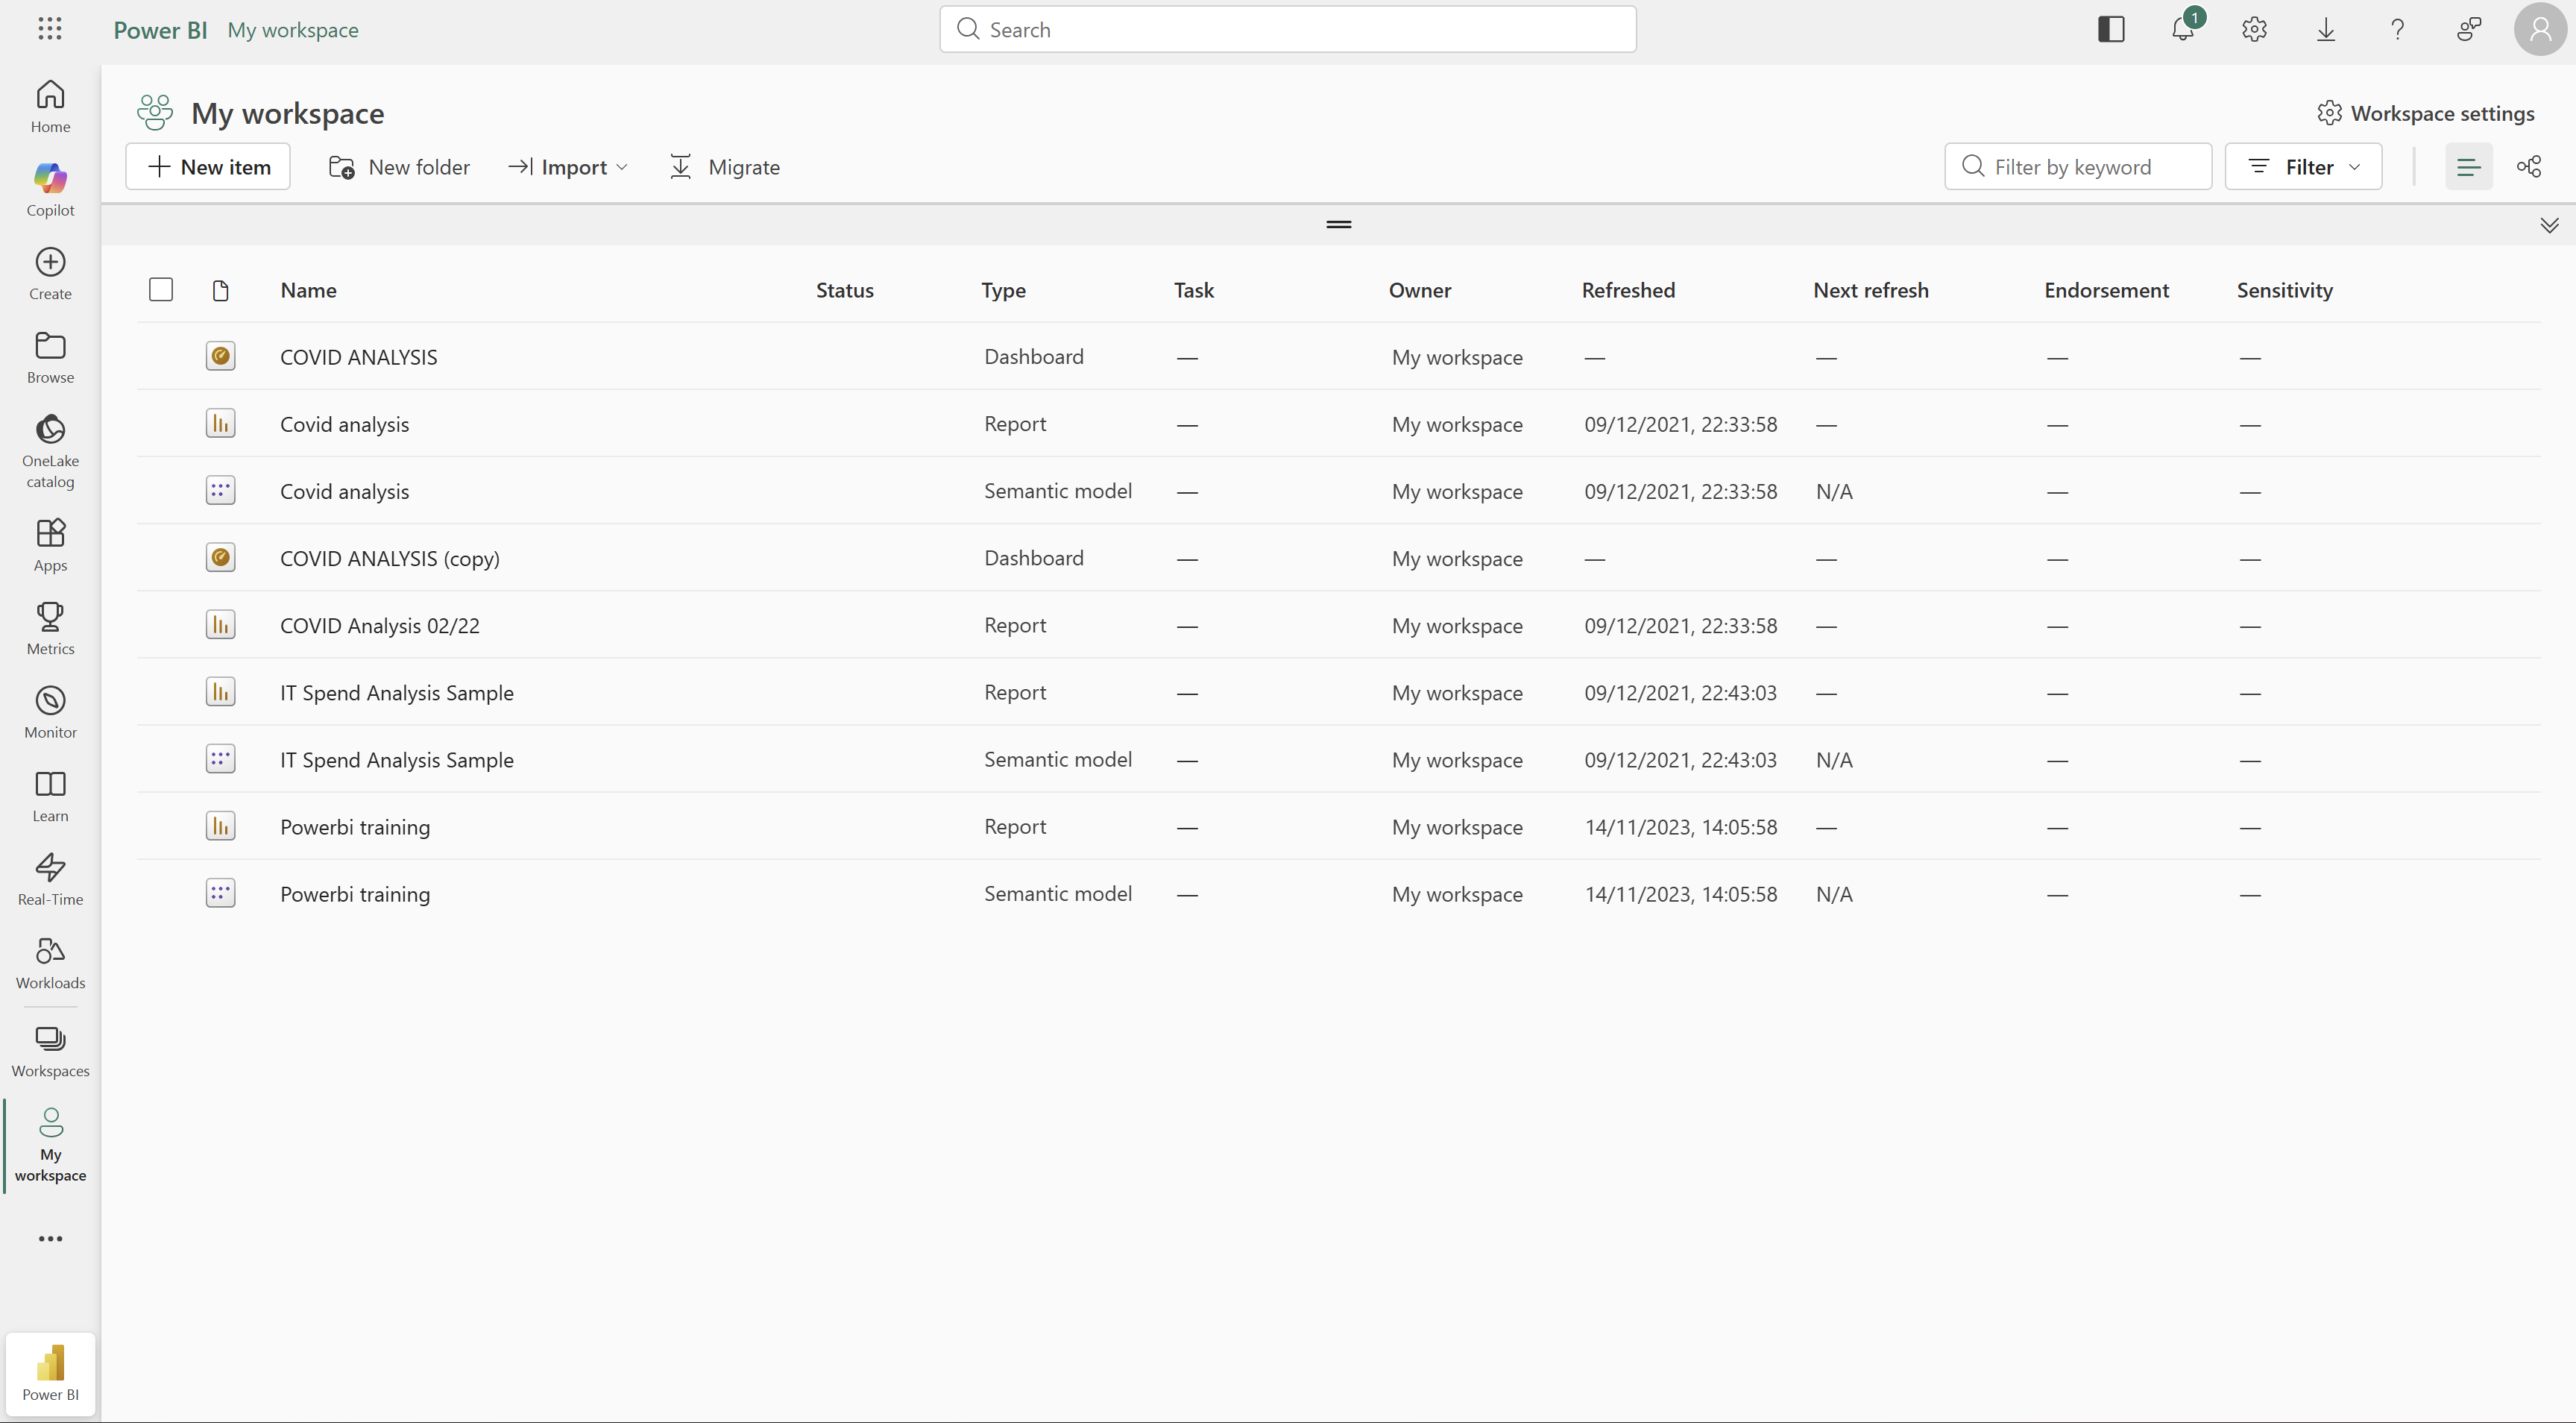
9.3 Workspaces: Where Reports Live
In the Power BI Service, reports are organized into Workspaces.
9.3.1 1. My Workspace
- This is your private sandbox.
- Do not use this for official program data.
- Risk: If you leave the organization, the dashboard disappears or becomes inaccessible to the team.
9.3.2 2. Shared Workspaces (Recommended)
- Collaborative spaces named after teams or projects (e.g., “National Malaria Program”, “Donor Reporting Team”).
- Multiple people can manage these reports.
- If you leave, the workspace remains.
- Requirement: Creating or joining a shared workspace requires a Pro License.
Best Practice: Always create a Shared Workspace for official Monitoring and Evaluation dashboards.
9.4 Step 1: Publishing Your Report
- Save your
.pbixfile in Power BI Desktop. - On the Home ribbon, click the Publish button.
- Sign in with your organizational account if prompted.
- Select the destination Workspace (e.g., “My Workspace” if you are on the free version).
- Wait for the “Success!” message.
Once published, open your web browser and navigate to https://app.powerbi.com to see your report live on the web.
9.6 Step 3: Keeping Data Fresh (Scheduled Refresh)
A dashboard showing last month’s data is an archive, not a monitoring tool.
You do not need to click “Refresh” in Desktop and re-publish every day. The Power BI Service can handle this automatically.
- Go to your Workspace in the browser.
- Find your Dataset (orange icon).
- Click the Settings (three dots …).
- Go to Scheduled Refresh.
- Set it to update daily (e.g., at 6:00 AM, before the team arrives).
Note: If your data comes from a local Excel file on your laptop, you will need a piece of software called a “Gateway.” If your data is in the cloud (SharePoint, DHIS2, SQL Server), refresh usually works directly.
9.7 A Note on Security: Row Level Security (RLS)
In Public Health, data privacy is paramount. Sometimes, you want one dashboard to serve the whole country, but:
- District A should only see District A’s data.
- District B should only see District B’s data.
- The National Director should see everything.
You do not need to build 20 separate reports.
You can use Row Level Security (RLS). This allows you to define rules (e.g., [District] = "User's District") so that Power BI filters the data based on who logged in.
While setting up RLS is an advanced topic, knowing it exists is essential for designing secure national systems.
9.8 Mobile Access
One of the biggest advantages of publishing is the Power BI Mobile App.
Field officers often do not have laptops, but they have smartphones. Once published, your report is accessible on iOS and Android.
Design Tip: In Power BI Desktop, you can use the Mobile Layout View to create a phone-optimized version of your dashboard that stacks visuals vertically for easy scrolling.
9.9 Final Hands-On: Publishing Your Work
Let’s finish the course by putting your work online.
- Publish: Click Publish in Power BI Desktop.
- Select: Choose My Workspace.
- View: Click the link “Open ‘Malaria Dashboard.pbix’ in Power BI”.
- Interact: In the browser, try clicking the slicers. Notice how it works exactly like the Desktop version.
- Comment: On the top menu, look for the Comment button. This allows you to tag a colleague to discuss a specific data spike (e.g., “@ Dr. Smith, why is malaria up in Coastal District?”).
9.10 Conclusion: You Are Now a Data Steward
We started this book with a folder of messy CSV files. You have learned to:
- Clean messy data using Power Query.
- Connect tables using the Star Schema.
- Calculate indicators using DAX.
- Visualize insights using Decision-Driven Design.
- Share results using the Power BI Service.
You are no longer just an “Excel user.” You are building systems that help save lives, improve efficiency, and direct resources where they are needed most.
The tools will change, Power BI updates every month, but the principles of Structure, Clarity, and Responsibility will always remain.
Go build something that matters.
Power BI for M&E and Public Health Data Analysts