Chapter: 6 The Star Schema: The Backbone of Analytical Models
Reliable analytics do not start with visuals or calculations. They start with structure.
In Power BI and in all analytical systems, the structure that enables clarity, consistency, and trust is the star schema.
The star schema is not a Power BI feature.It is a data modeling pattern that predates modern BI tools and remains the foundation of professional analytics.
Once you understand it, most modeling decisions become obvious.
6.1 What is a Star Schema ?
A star schema organizes data around a single central table of events, surrounded by descriptive tables.
The fact table sits at the center
Dimension tables radiate outward
Relationships form a star-like shape
Each table has a single responsibility.
The star schema is:
A way of thinking
A way of separating meaning
A way of protecting definitions
It is not:
A Power BI layout trick
A performance hack
A cosmetic design choice
6.2 The Central Idea: Events Surrounded by Context
At the core of the star schema is a simple question:
What actually happened?
The answer lives in the fact table.
Everything else exists to describe that answer.
6.3 Fact Tables: Recording Reality
A fact table records events as they occurred.
Each row answers the question:
“Something happened. What was it?”
Fact tables typically contain:
Identifiers (who, where, when)
Measurements (counts, flags, results)
They do not explain context in detail.
6.4 Dimension Tables: Stable Descriptions
A dimension table provides descriptive context for events.
Each row answers the question:
“What do we know about this entity?”
Dimension tables:
Change slowly
Contain descriptive attributes
Are reused across multiple analyses
Examples:
One row per patient
One row per facility
One row per calendar date
Dimensions do not record activity. They provide meaning.
6.5 Why Facts Should Not Contain Descriptions
A common beginner instinct is to “simplify” analysis by copying descriptive fields into the fact table.
For example:
Facility name stored on every visit row
District repeated thousands of times
Patient age recalculated inconsistently
Month and year embedded as text
This creates three problems:
Redundancy : The same information appears repeatedly.
Inconsistency : Descriptions drift over time.
Fragility : Small changes require rebuilding reports.
In a star schema:
Fact tables contain keys and measurements
Dimension tables contain descriptions
This separation protects historical meaning.
6.6 The Role of Keys: Connecting Meaning Without Carrying It
Relationships exist because tables share keys.
A key:
Uniquely identifies a record
Is stable over time
Has no analytical meaning itself
Good keys:
Patient IDs
Facility IDs
Date IDs
Bad keys:
Names
Labels
Descriptions
Keys exist to connect meaning, not to store it.
6.7 Relationships: How Meaning Flows
Relationships tell Power BI:
Which tables are connected
How filters propagate
Which tables control context
Without relationships, tables are isolated files. With correct relationships, the model behaves predictably.
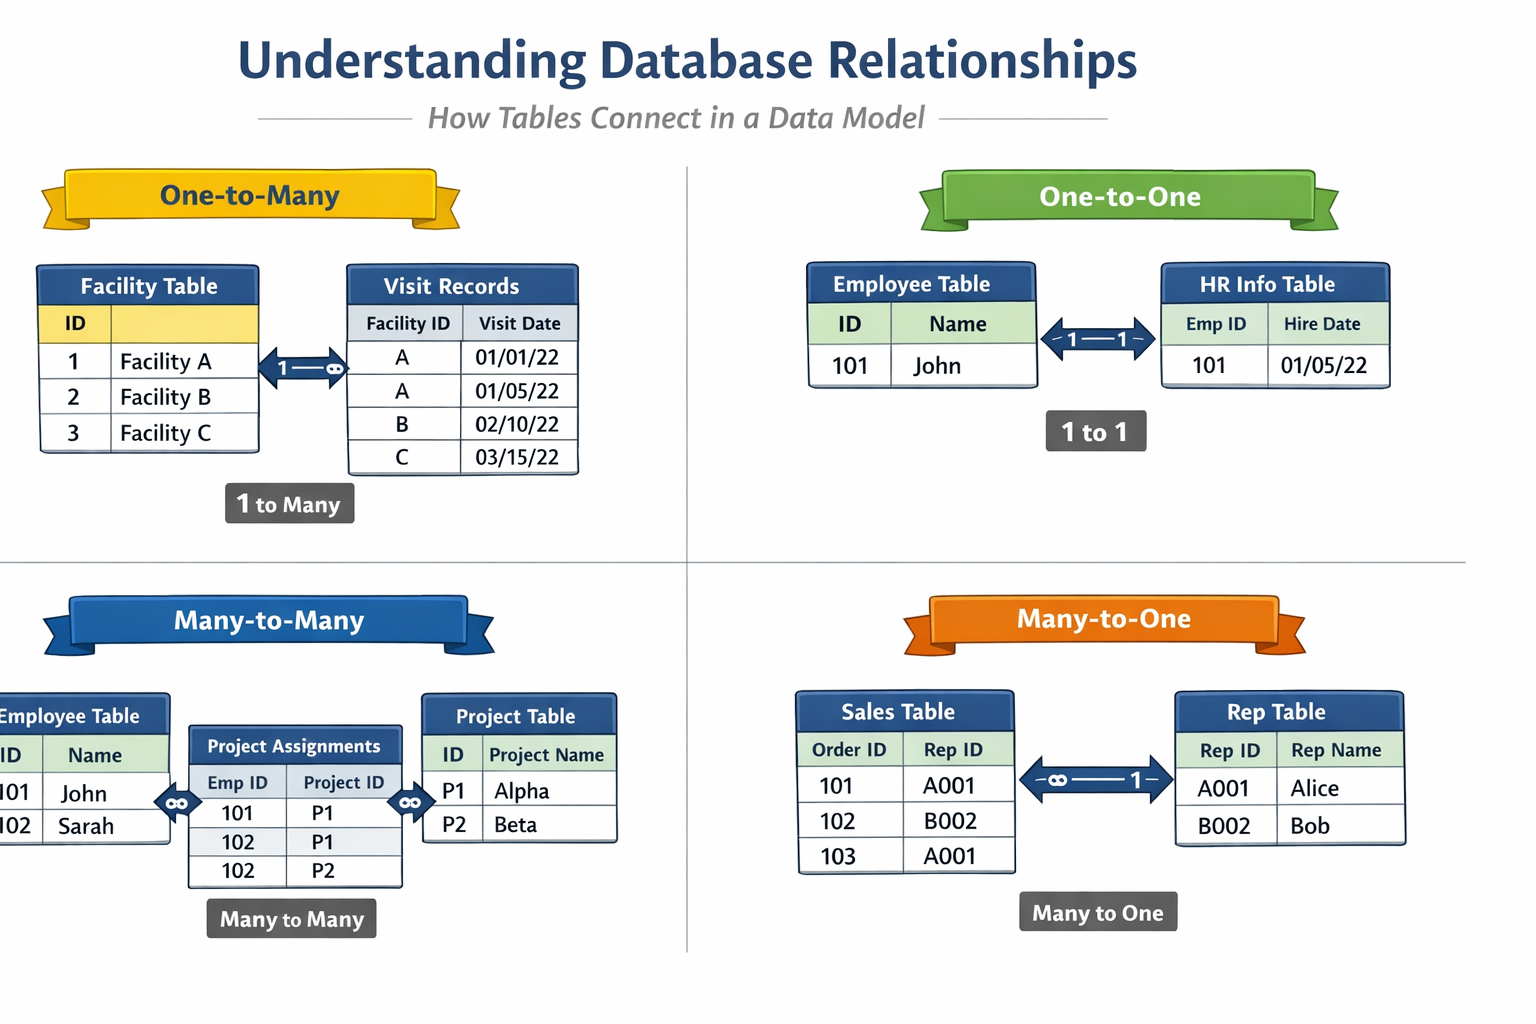
One-to-Many: The Default Relationship
In a star schema, relationships are almost always one-to-many.
Examples:
One patient → many visits
One facility → many visits
One date → many visits
In Power BI terms:
Dimension table = one
Fact table = many
This pattern mirrors reality and supports reliable aggregation.
6.8 Filter Direction: Why It Must Be One-Way
Relationships are directional.
In a well-designed star schema:
Filters flow from dimension → fact
Not from fact → dimension
This reflects real-world logic:
Selecting a district limits visits
Selecting a patient limits events
Selecting a date limits outcomes
Note: Allowing filters to flow both ways introduces ambiguity and should be avoided unless there is a very specific, justified reason.
6.9 Why Dimensions Should Not Connect to Each Other
Another common mistake is linking dimension tables directly.
For example:
dim_patientlinked todim_facilitydim_facilitylinked todim_date
This creates:
Multiple filter paths
Ambiguous context
Unpredictable results
In a star schema:
Dimensions connect only to the fact table
The fact table is the bridge between all context
If two dimensions need to interact, they do so through events.
6.10 Time as a First-Class Dimension
Time is not just a filter.
A date has structure:
Day
Month
Quarter
Year
Reporting period
Fiscal calendar
Embedding raw dates in fact tables limits analysis.
A dedicated date dimension enables:
Consistent aggregation
Year-over-year comparison
Alignment with reporting calendars
This is why professional models never rely on raw date fields alone.
6.11 Visualizing the Star (Mental Model)
Think of the model this way:
- The fact table is the question
- Dimensions are the ways to slice the answer
If you remove the fact table, nothing is left to analyze.
If you remove a dimension, analysis still works but just with less context.
This is how you know the structure is correct.
6.12 Hands-On: Building the Star Schema in Power BI
This section translates the concepts you have learned into practical modeling steps. Do not rush. Every action here reinforces the mental model you have just developed.
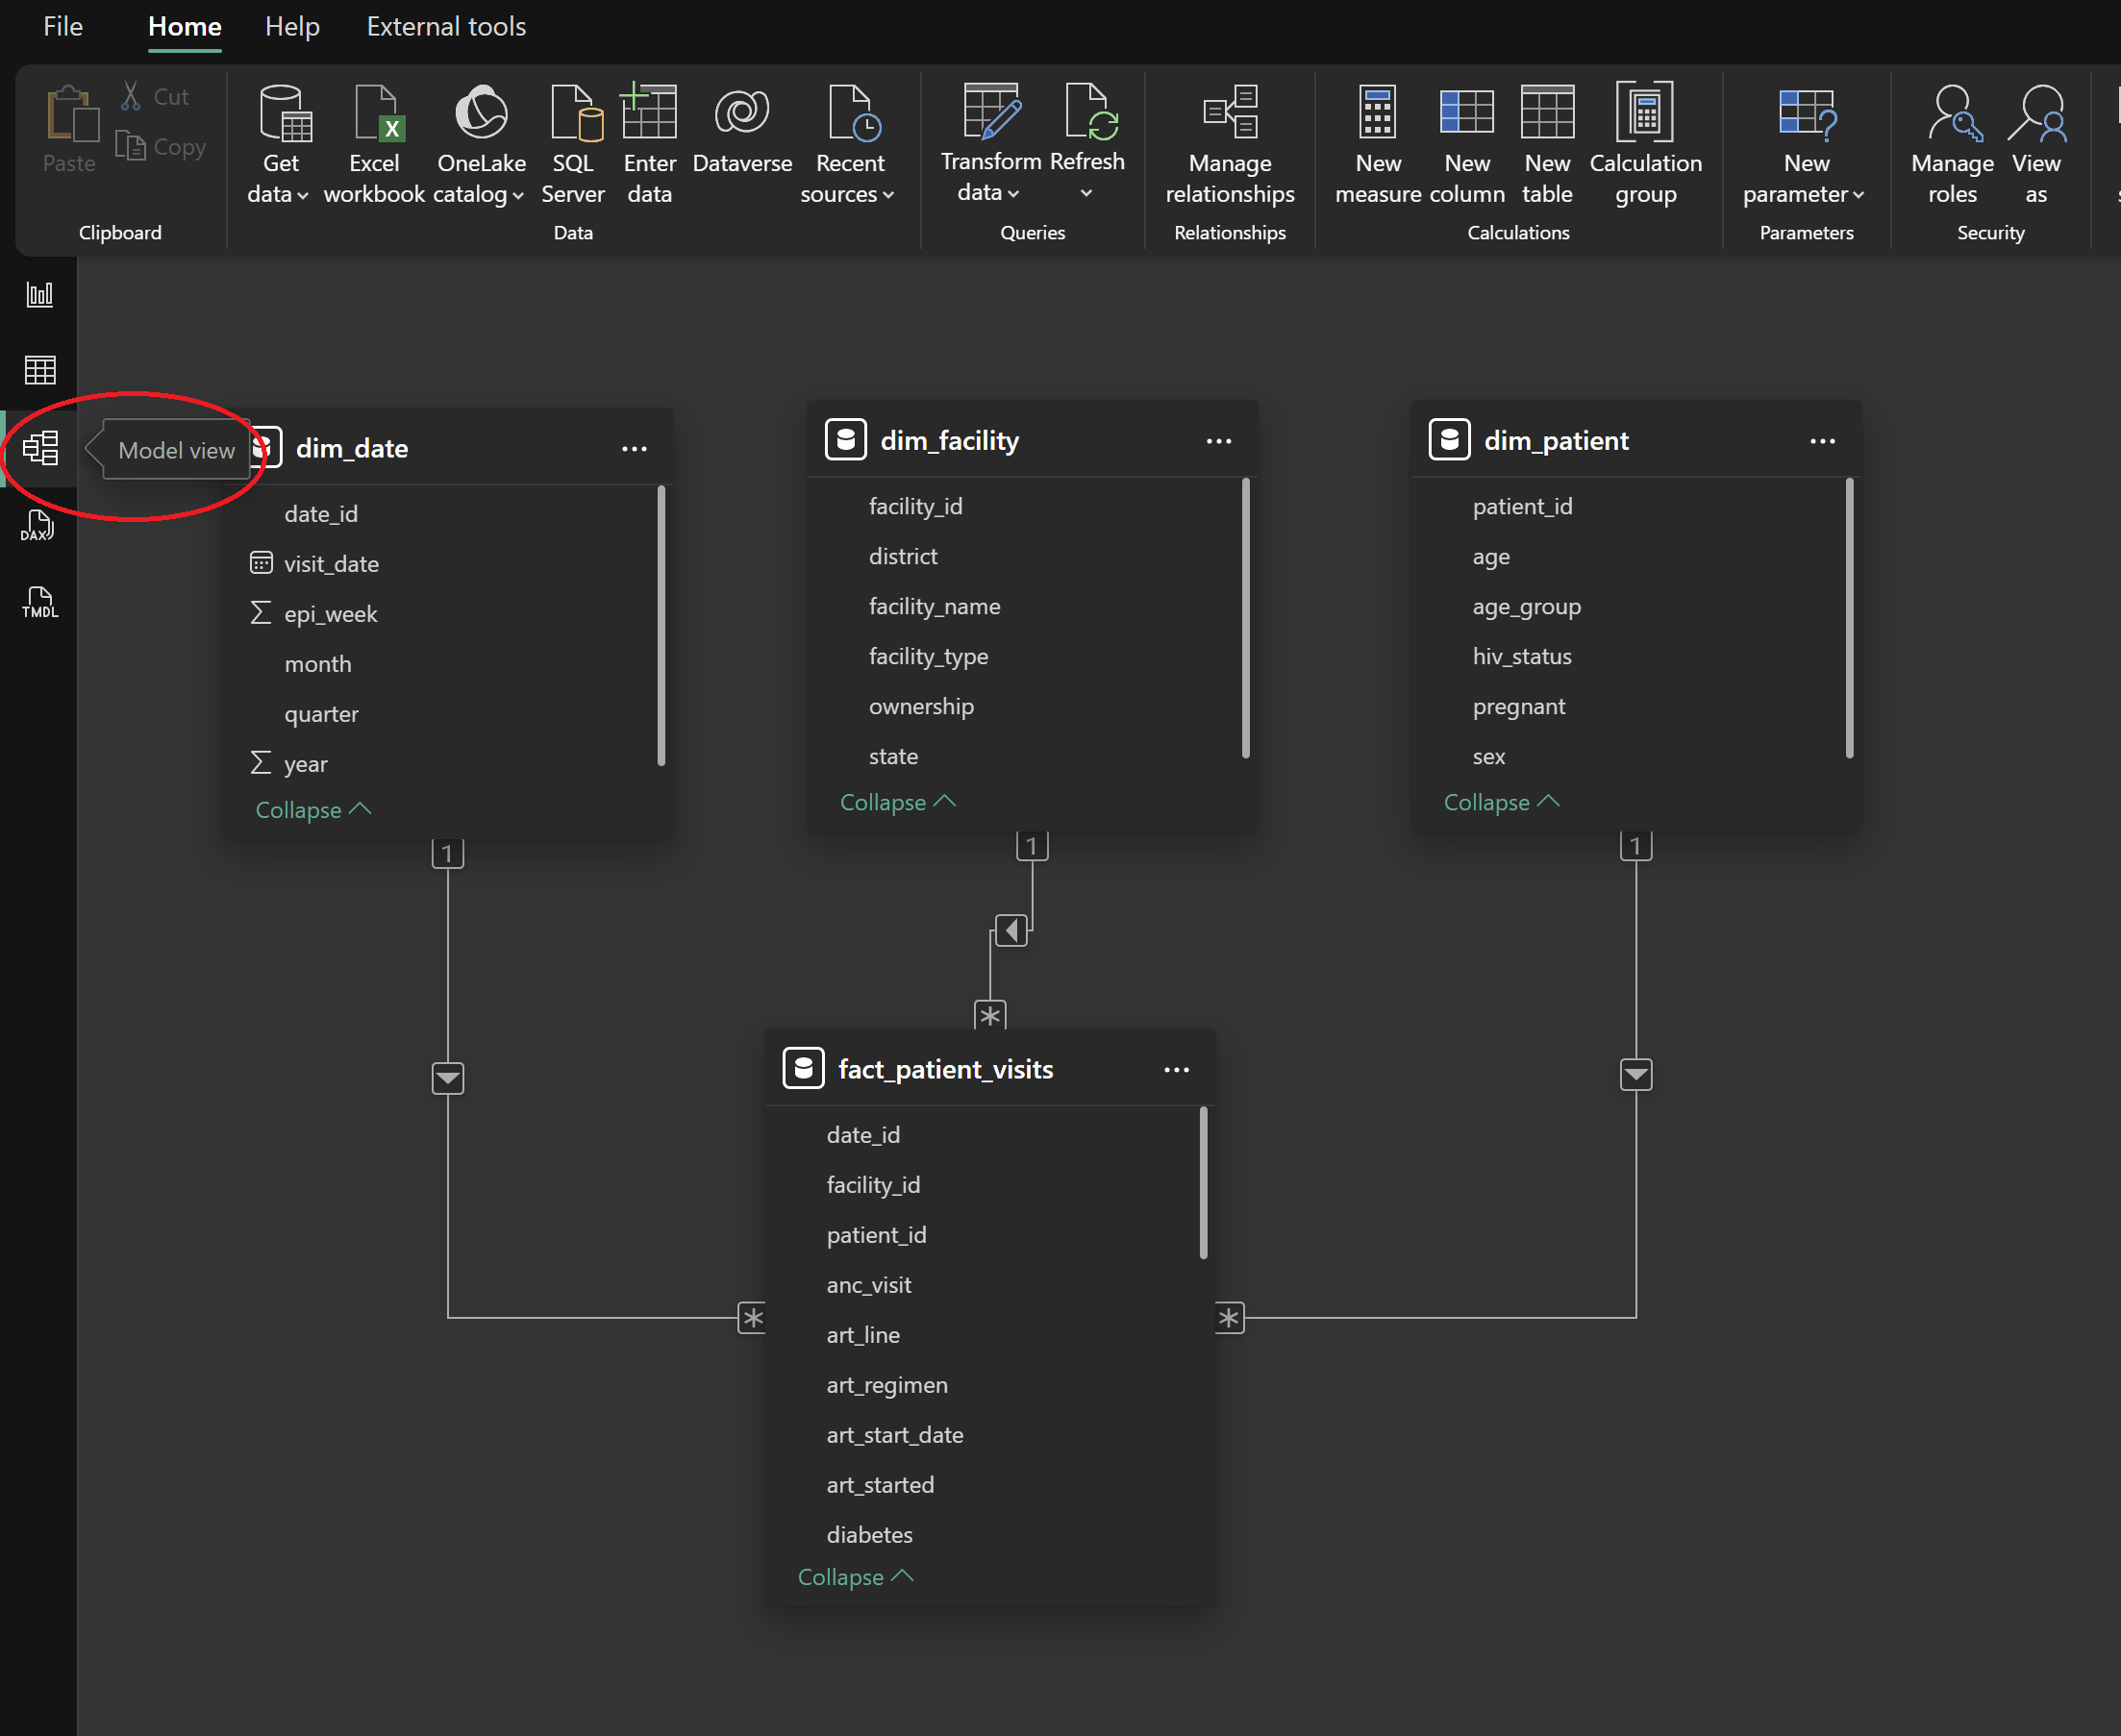
Step 1: Switch to Model View
After completing data cleaning in Power Query:
Close the Power Query Editor
In Power BI Desktop, select the Model View icon from the left sidebar
You should see all imported tables displayed separately.
At this stage, Power BI may show suggested relationships. Do not accept or rely on them yet.
Step 2: Classify Tables Before Creating Relationships
Before dragging any fields, pause and classify each table using the concepts from this chapter.
Using the datasets in this book:
-
Fact table
fact_patient_visits
-
Dimension tables
dim_patientdim_facilitydim_date
Ask yourself:
Which table records events?
Which tables describe context?
If this is unclear, return to the earlier sections before proceeding.
Step 3: Identify Relationship Keys
Each relationship requires a key that uniquely identifies a record in a dimension table.
Confirm the following keys exist:
dim_patient[patient_id]dim_facility[facility_id]dim_date[date_id]
In the fact table, these same fields appear repeatedly as references.
Reminder:
Keys connect meaning. They do not describe it.
Step 4: Create Dimension-to-Fact Relationships
Create relationships manually to ensure correctness.
Example: Patient to Visits
Drag
patient_idfromdim_patientDrop it onto
patient_idinfact_patient_visits
In the relationship dialog, confirm (see image below):
- Cardinality: One-to-many
- Cross-filter direction: Single
- Active relationship: Yes
Repeat the same process for:
facility_id→dim_facilitydate_id→dim_date
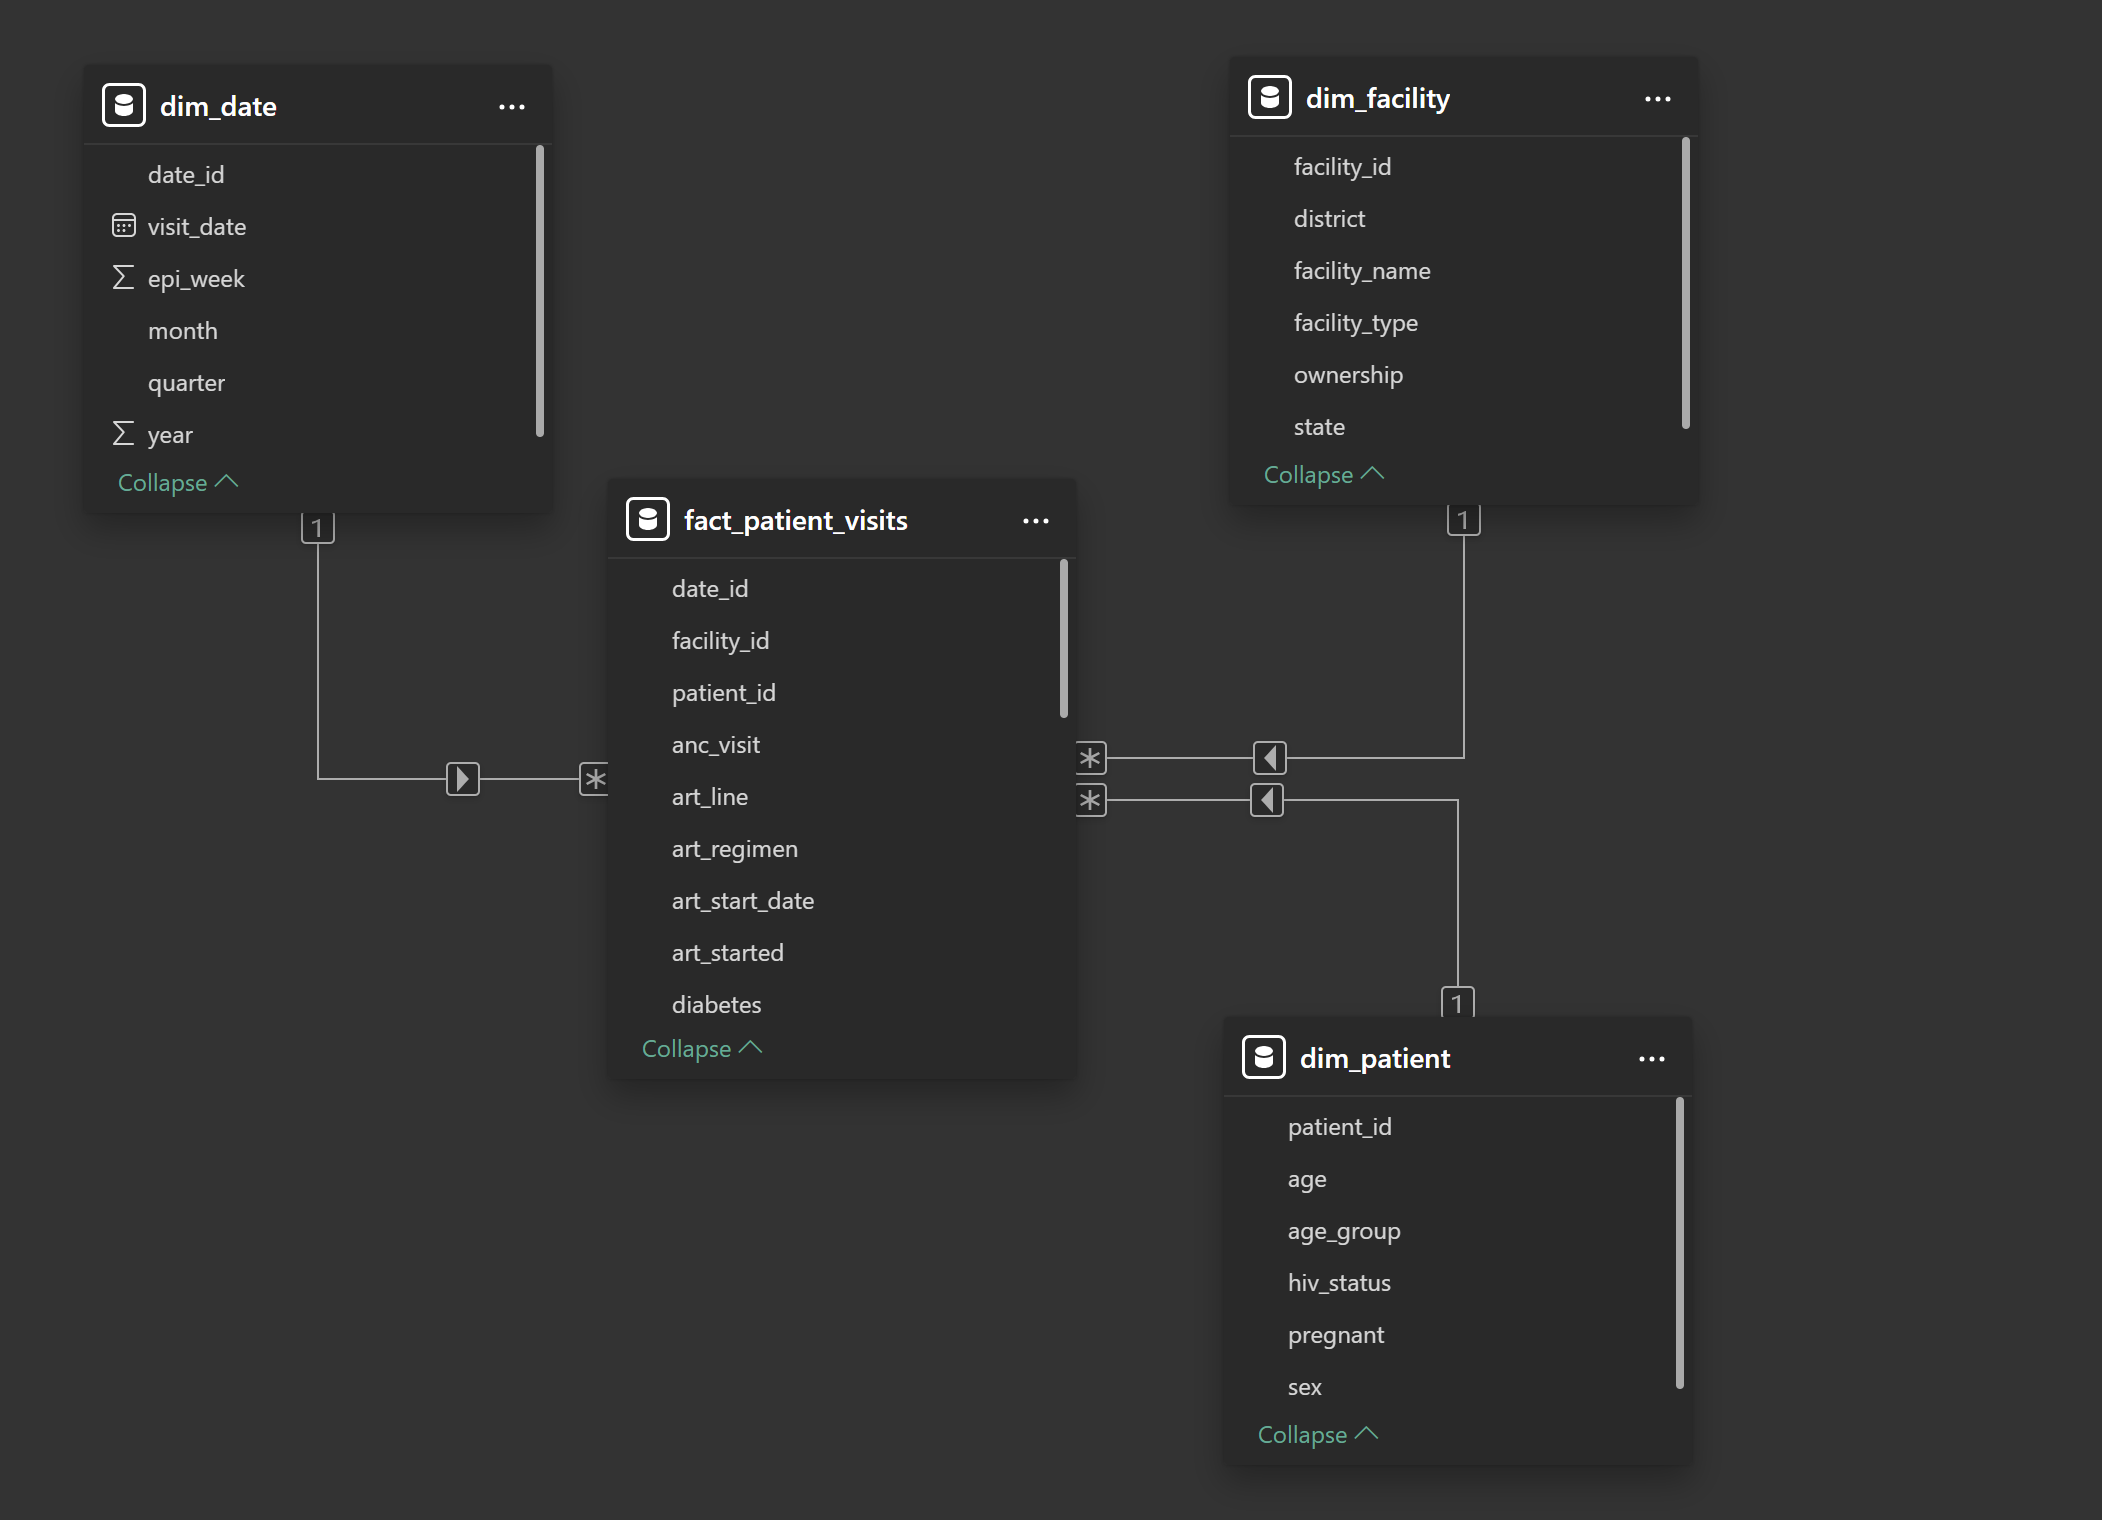
Step 5: Enforce the Star Shape Visually
Arrange tables in the Model View so that:
fact_patient_visitssits at the centerDimension tables surround it
No dimension table connects directly to another dimension
This visual layout is not cosmetic.
It reinforces correct analytical thinking and simplifies
troubleshooting.
Step 6: Validate Filter Flow
Before building visuals or calculations, test whether the model behaves as expected.
Switch to Report View
Add a simple table visual
-
Add:
- Facility Name (from
dim_facility) - Count of rows from
fact_patient_visits
- Facility Name (from
Now apply filters:
Select a district
Select a reporting period
If counts respond logically, filter flow is working correctly.
If not, return to Model View and review relationships.
Step 7: Hide Technical Fields (Optional but Recommended)
Keys are essential for modeling but confusing for report users.
To hide them:
Switch to Data View
Right-click technical fields
such as:
patient_idfacility_iddate_id
- Select Hide in report view
This prevents accidental misuse during visualization.
6.13 Common Modeling Errors to Watch For
Most Power BI models do not fail loudly. They fail quietly. Numbers still appear, Charts still render, Filters still move but the logic underneath becomes unstable.
The following mistakes are responsible for the majority of “almost correct” dashboards in public health and M&E.
1. Many-to-Many Relationships Created Unintentionally
This is one of the most dangerous modeling errors because Power BI often allows it without warning.
Why it happens
Many-to-many relationships usually appear when:
- A dimension table contains duplicate keys
- A fact table is linked to another fact table
- Text fields are used as join keys
- Aggregated data is mixed with transaction-level data
In health data, this commonly happens when:
- Facility names are duplicated across systems
- Patient identifiers are inconsistent
- Monthly summaries are joined directly to line lists
Why it is dangerous
Many-to-many relationships:
- Inflate counts
- Distort totals
- Produce inconsistent results depending on filters
- Make DAX calculations unpredictable
The same indicator may return different values depending on where it is used.
How to think your way out
If a relationship is many-to-many, pause and ask:
- “What is the event?”
- “What is the description?”
- “Should these tables even be directly connected?”
In most cases, the solution is:
- Introduce or fix a dimension table
- Clean keys
- Revisit granularity
2. Bi-Directional Filters Applied Without Justification
Bi-directional filtering allows context to flow in both directions between tables.
It feels powerful.
It is rarely necessary.
Why it happens
Users often enable bi-directional filters because:
- A visual “doesn’t work”
- A slicer does not behave as expected
- Power BI suggests it automatically
Instead of fixing structure, filters are allowed to flow both ways.
Why it is dangerous
Bi-directional filters:
- Create hidden filter paths
- Introduce ambiguity
- Make results dependent on visual layout
- Break assumptions in DAX measures
The model becomes difficult to reason about.
How to think your way out
In a star schema:
- Dimensions define context
- Facts respond to context
If you feel the need for bi-directional filters, it often means: - The model is not truly star-shaped - Tables are playing multiple roles - A bridge table is missing
Fix structure before changing filter direction.
3. Descriptive Fields Used as Relationship Keys
Using names, labels, or descriptions as join fields is a common beginner shortcut.
It almost always leads to long-term problems.
Why it happens
Descriptive fields are:
- Human-readable
- Easy to recognize
- Available in every dataset
So they feel convenient.
Why it is dangerous
Descriptions:
- Change over time
- Are not guaranteed to be unique
- May be spelled inconsistently
- May include formatting differences
When a description changes, historical analysis breaks.
How to think your way out
Relationships should be built on:
- Stable identifiers
- Surrogate keys
- Fields with no business meaning
Descriptions belong in dimension tables.
Keys exist only to connect.
4. Dimension Tables Linked Directly to Each Other
Linking dimension tables may feel logical, but it breaks analytical clarity.
Why it happens
This usually occurs when:
- Users try to “help” Power BI navigate context
- Dimensions share a common attribute
- The fact table feels unnecessary
Why it is dangerous
When dimensions link directly:
- Filter paths multiply
- Context becomes ambiguous
- Results depend on evaluation order
- Measures become fragile
Power BI can no longer determine a single, authoritative path.
How to think your way out
In a star schema:
- Dimensions never describe each other
- They describe events
If two dimensions need to interact, ask:
- “Where did this interaction occur?”
- “What event connects them?”
The answer almost always points back to the fact table.
6.14 A Simple Rule to Remember
If your model:
- Is hard to explain
- Requires frequent filter overrides
- Produces inconsistent totals
- Breaks when visuals change
The problem is rarely DAX. It is almost always the model. Strong models make analytics boring. Weak models make analytics confusing.
This chapter exists to help you build the former.
6.15 Reflection: Why This Step Matters
At this point, you have not created a single indicator or chart.
Yet you have already:
- Defined how data flows
- Controlled how context is applied
- Protected future calculations from ambiguity
This is the difference between building dashboards and building analytical systems.
6.16 Stop Point: Do Not Move Forward Yet
Before proceeding to calculations, confirm:
- There is exactly one central fact table
- All dimensions connect only to the fact table
- All relationships are one-to-many
- Filter direction flows from dimension to fact
If any of these conditions are not met, fix them now.
6.17 What Comes Next
With a proper star schema in place, Power BI can now:
- Understand context
- Apply filters consistently
- Support reusable indicator definitions
The next chapter introduces DAX measures, where numerators and denominators are defined once and trusted everywhere.
A strong model makes DAX simpler. A weak model makes DAX fragile.
Power BI for M&E and Public Health Data Analysts